Bilateral graphs are commonly used in economics because of how easy you can compare multiple variables. A bilateral graph shows multiple bar graphs grouped together by a common variable. the One above groups three seperate variables by another variable which is the year. Export, mport, and total Trade are the bilateral bars that are grouped together by year.
Trey Chabot
Monday, April 2, 2012
Unstandardized Choropleth Map
http://www.censusscope.org/us/map_common_race.html
Unstandardized Choropleth Maps are used to show a variable across a geographical area. What differs an unstandardized choropleth map from other choropleth map is that it shows the data in a uniform setting, and put to a percent. Not all maps are put to a standard scale, the above unstandardized map is comparing different ethnicities across the US.
DRG
http://infoecho.net/cschin/topo3d/
DRG or Digital Raster Graphic is a topograhpic map that is scanned and used to show features of a map. They are used in mpa making because of how in detail it can show the physical features of an area. The above picture is of Yosemite National Park. Raster Graphics are created by the USGS and are printed with a resolution of 250 dots per inch.
Cartographic Animations
Cartographic Animations are used to show maps as an animation, much like a moving picture in geography. Cartographic Animations are very useful in showing the movement of an object over a landmass, like the above example of a hurricane nearing the United States. Or cartographic animations could be used to show a flood plain, and how it is effected by rising river levels.
Planimetric Map
http://proceedings.esri.com/library/userconf/proc01/professional/papers/pap949/p949.htm
Planimetric maps are maps made primarily of rectangles, they show no elevation like a topographic map. They can also be called "line" maps, because they only show structures as a flat map. Planimetric maps can be very useful in city planning and drawling up counties. The above Planimetric map is of the Gowanus Canal in New York City. Showing roads, commerical, and industrial episodes with not further features of the land.
Continuously Variable Proportional Circle Map
http://www.esds.ac.uk/international/support/user_guides/gisoverview.asp
Continuously variable proportional circle map, is much like a proportional circle map but instead of the size of the circle representing a number, the circles are spread across a geographical area. Representing variables in "pies" across the map. These maps are very useful in showing age, or ethnicity across a population, each color on the pie representing the amount of that specific variable.
LIDAR
https://www.ars.usda.gov/is/pr/2010/100609.htm
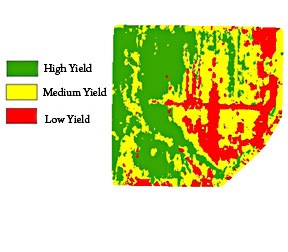
LIDAR or Light Detection And Ranging, is a remote sensing tool that uses light and lasers to map different geographical areas. Measuring the distance from the laser with light helps them detect the different variables they are trying to find. LIDAR is used all throughout science, in geology, forestry, remote sensing and geomatics. The above LIDAR map is of the agricultural yeild possibilities of a piece of land.
Subscribe to:
Comments (Atom)


