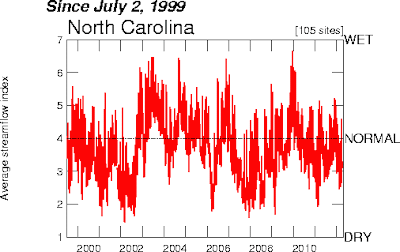
Index Value plots are used to statisically and graphically compare a variable. As you can see above the index value plot is showing the average stream flow of North Carolina. Index value plots are great for showing data across a longer time frame, like above it is showing the data from 10 years.

No comments:
Post a Comment